


Atmosphere 2024, 15(4), 503; https://doi.org/10.3390/atmos15040503 (registering DOI) - 19 Apr 2024
Abstract
Ambient pollen proteins play key roles in the incidence of allergenic respiratory health, and numerous reports have focused on respiratory diseases caused by air pollutants. However, there is still a lack of understanding of the specific mechanisms underlying the involvement of microbiota in
[...] Read more.
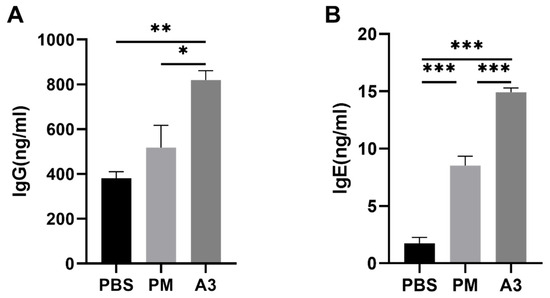
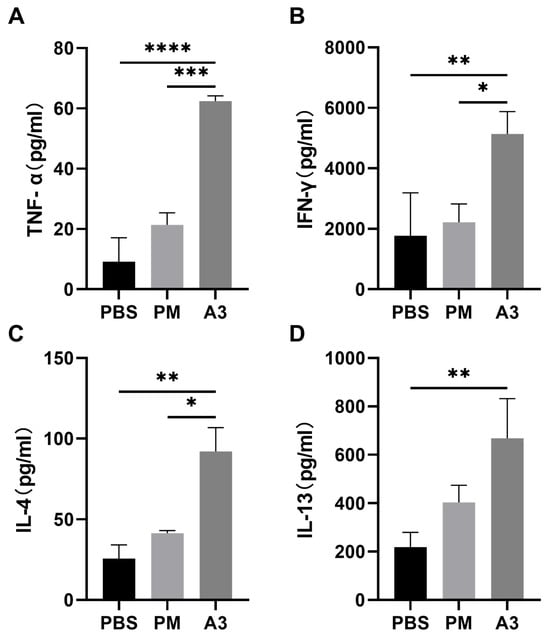
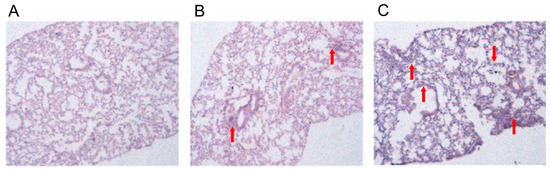
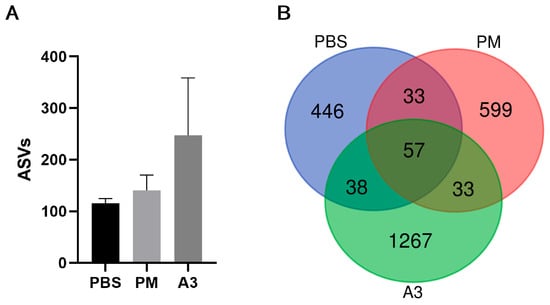
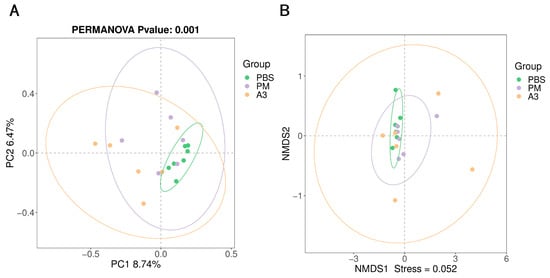
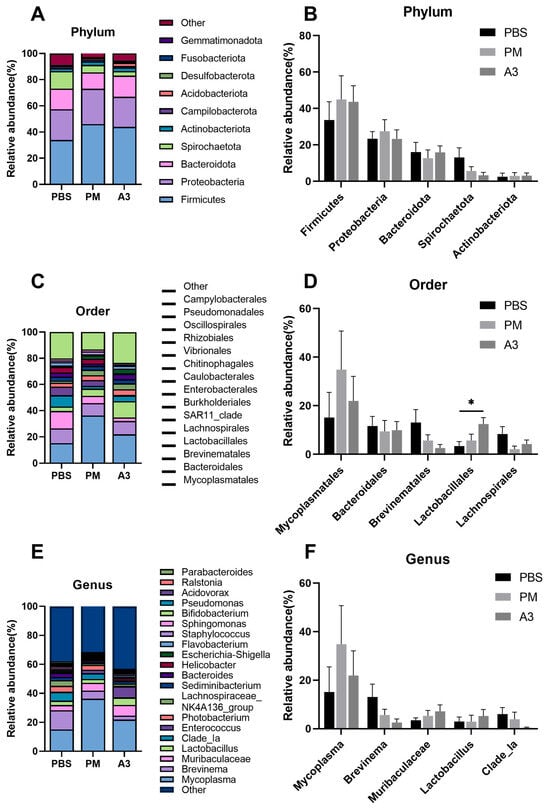
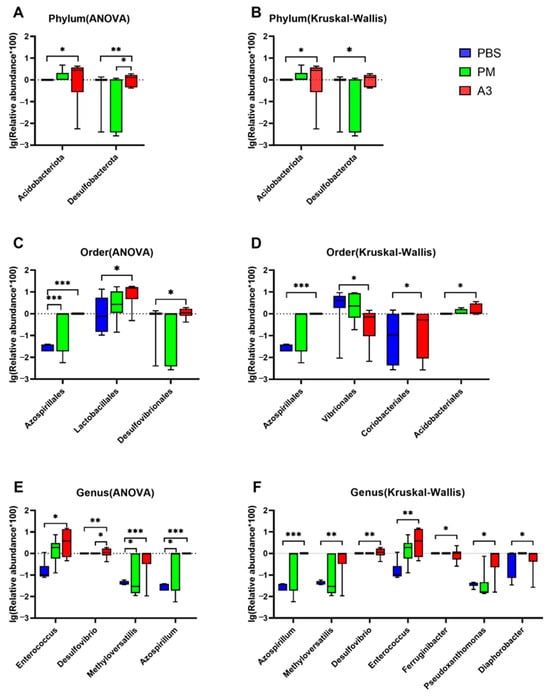
Ambient pollen proteins play key roles in the incidence of allergenic respiratory health, and numerous reports have focused on respiratory diseases caused by air pollutants. However, there is still a lack of understanding of the specific mechanisms underlying the involvement of microbiota in the respiratory tracts and effects induced by air pollutants. Therefore, an allergenic animal model was established to investigate the characterization of microbials in the lung induced by allergenic Platanus pollen protein (Pla a3) and ambient fine particulate matter. Our data showed that the mice exhibited strong immune and inflammatory responses after being exposed to PMs and Pla a3 protein. This included increased levels of immunoglobulins IgG and IgE, as well as elevated levels of cytokines TNF-α, IFN-γ, IL-4, and IL-13. Furthermore, the amounts of pathogenic bacteria, such as Desulfobacterota, Enterococcus, Ferruginibacter, and Pseudoxanthomonas, in the lung microbiota of the Pla a3 exposure group increased significantly. Correlation analysis revealed a strong association between specific lung bacteria and alterations in cytokines from the lung samples. Probiotic bacteria, Deferribacterota and Bifidobacterium, was associated with changes in the level of IgG and IgE. However, pathogenic bacteria, like Prevotella and Fusobacterium, were linked with the cytokines IL-4 and TNF-α.
Full article
(This article belongs to the Special Issue Composition Analysis and Health Effects of Atmospheric Particulate Matter)
►
Show Figures

Figure 1


